Statistics
Accessing Statistics
The Statistics feature in Geonode helps you understand how you're using our services. It shows you important details like how much bandwidth you're using, how many requests you're making, and more. You can access this feature from your service dashboard to keep track of everything in one place and make sure you're getting the most out of Geonode.
Step 1: Access the Statistics Tab
Access the Geonode Dashboard using your registered account credentials. Select the desired service/product for which you want to view statistics. Locate and click on the "Statistics" tab within the service/product dashboard.

Step 2: Monitoring and Stats
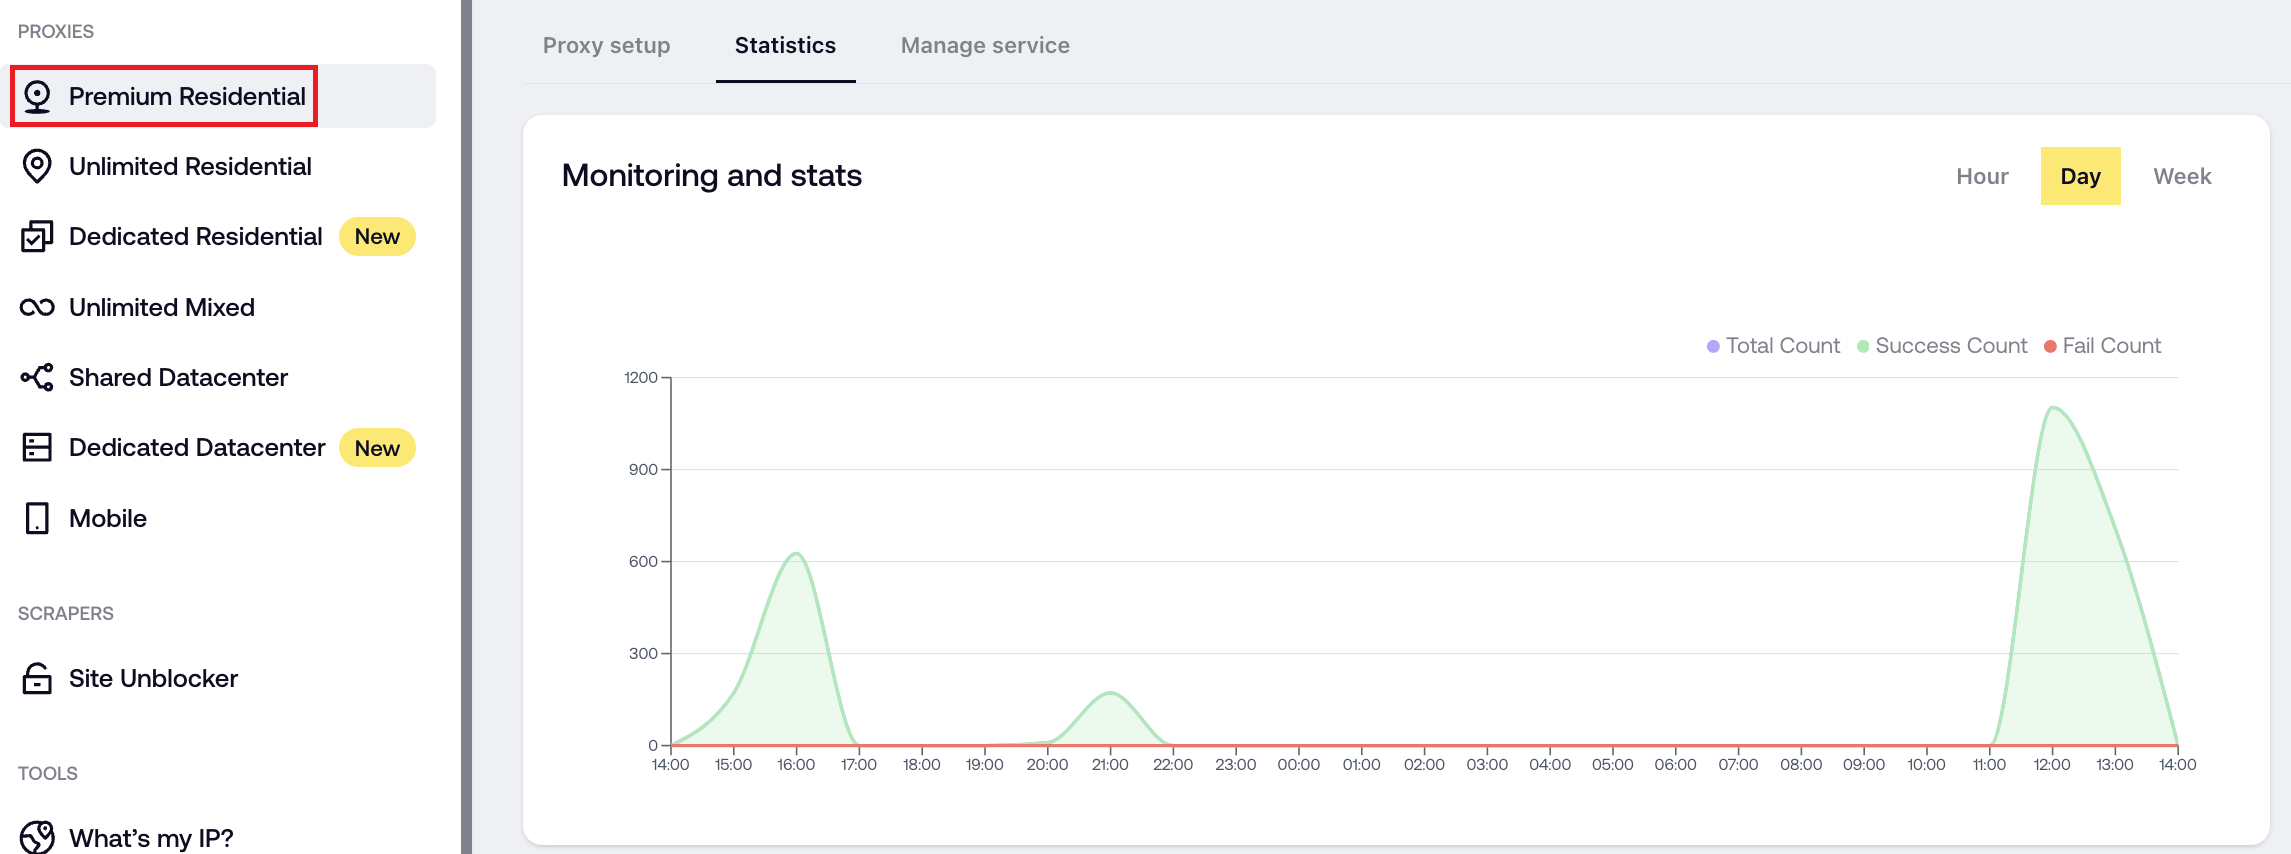
Within the Statistics tab, find the section labeled "Monitoring and Stats." Click on the buttons to select the desired time interval (hour, day, or week). Review the provided data and graphs to gain insights into service usage and performance metrics.
Step 3: Bandwidth Monitoring
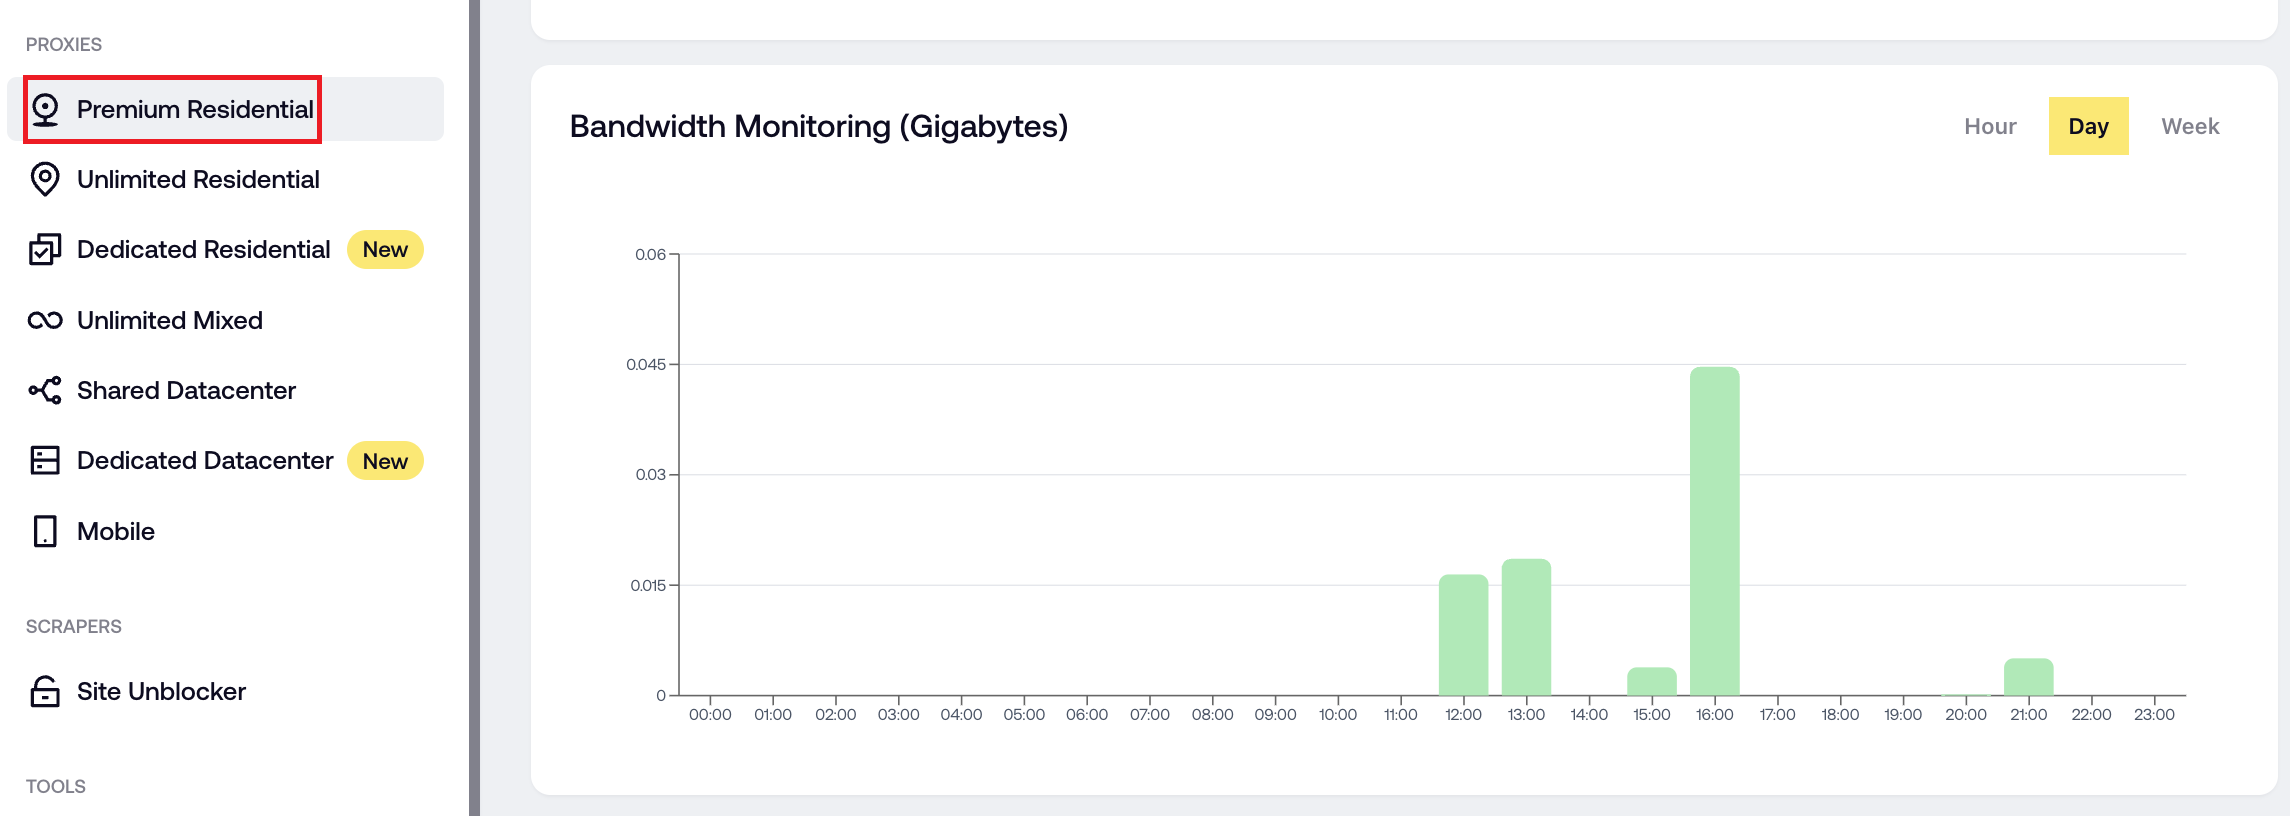
Scroll down to the "Bandwidth Monitoring" section within the Statistics tab. Choose the preferred time interval (hour, day, or week). Analyze the bandwidth usage data displayed in Gigabytes to understand usage patterns over time.
Step 4: Current service Overview
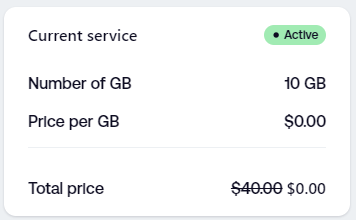
On the right side of the dashboard, locate the "Current Service" section. Review the summary information provided, including the active indicator, Gigabytes used, price per Gigabyte, and total subscription price.
Step 5: Bandwidth Section
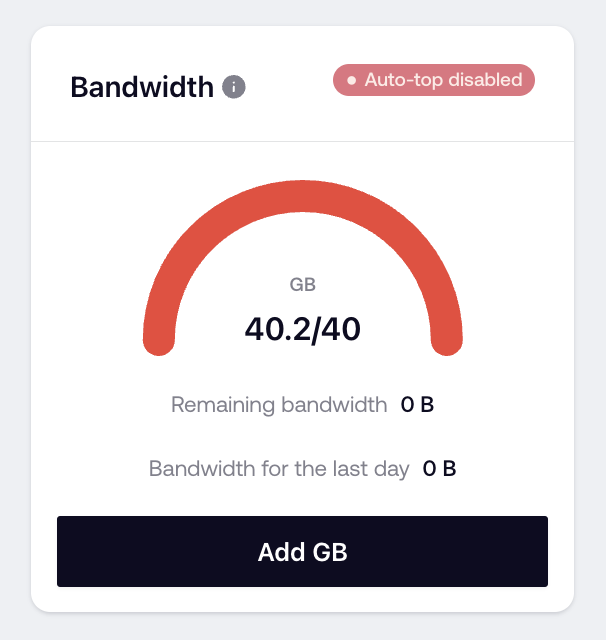
Below the current service overview, find the "Bandwidth" section. Review the details about the total available bandwidth and current usage. To add more bandwidth, click on the "Add GB" button and follow the prompts to complete the process.
Step 6: Resources
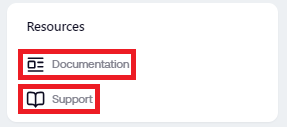
Navigate to the bottom of the Statistics tab and locate the "Resources" section. Click on the "Documentation" link to access helpful guides and documentation. Click on the "Support" link to reach out to customer support for assistance if needed.
Step 7: Request analytics
Find the "Request analytics" section within the Statistics tab. Review the table displaying request data, including success rate, bandwidth usage, and average latency. Use the search box to filter data or click on the "Export" button to export the data for further analysis if required.

Step 8: Sticky sessions
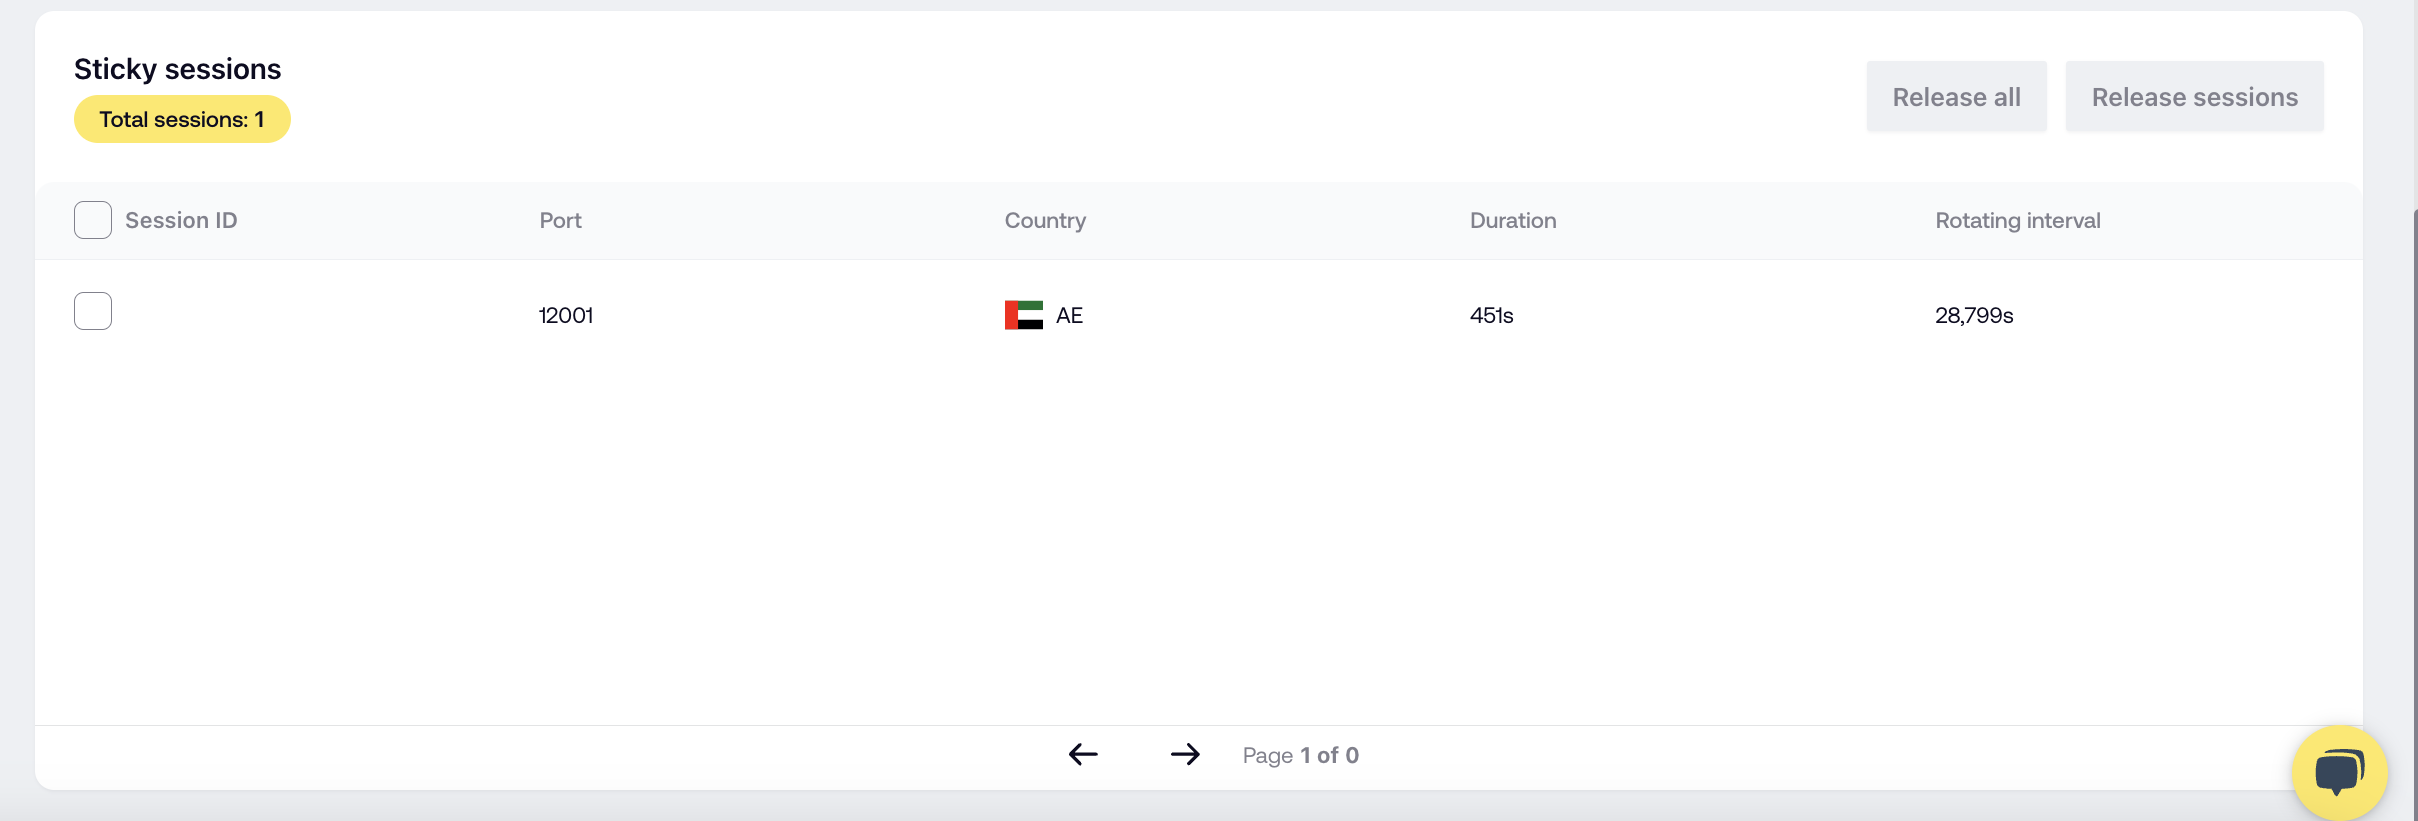
Scroll down to the "Sticky Sessions" section at the bottom of the Statistics tab. Review the total number of sessions and session details displayed in the table format. To release all sessions, click on the "Release all" button. To release individual sessions, click on the "Release sessions" button and follow the prompts.
