This guide contains a combined script utilizing Python’s requests library to help you test the latency and success rate of your proxies.
Overview
This script is designed to help you test the performance of your proxies by measuring latency and tracking the success rate of requests. It supports SOCKS5 and HTTPS proxies and uses ip-api.com as the default target URL to test. You can also test other endpoints like Cloudflare’s trace URL to benchmark proxy performance.What You’ll Learn
- How to use the script to test latency and success rate across multiple proxy requests.
- How to configure the proxy protocol (SOCKS5 or HTTP).
- How to run the script using rotating or sticky ports.
- How to analyze the test results, including latency statistics and status code breakdown.
Default Settings
- Protocol: Use SOCKS5 = false or HTTPS as required.
- Target: ip-api.com – our baseline for IP information.
- Concurrency: 5-10 threads (adjustable in the script)
- Testing Volume: At least 2000 requests for accuracy
Variable Setting
The script allow you to set the following variables:- Target Country: (User-defined; leave blank ( do not append -country- ) for a random pool)
- Protocol: Choose between HTTP, HTTPS, or SOCKS5 ( default is HTTP/HTTPS )
- Session Type: Rotating (default)
- Target URL: The URL to test against (default is set to ip-api.com)
- Number of Requests: Adjust for your testing needs
Recommendation: For accurate results, run at least 2000 requests and use 5-10 threads.
The test results can vary depending on the Gateway you are choosing as the proxy address. We currently offer 3 gateways location.
Port Ranges
-
Rotating Ports: Rotating ports will change your IP on every request sent.
- HTTP/HTTPS: 9000 - 9010
- SOCKS5: 11000 - 11010
-
Sticky Ports: Sticky ports enable you to maintain the same IP for any duration that you assign on the dashboard.
- HTTP/HTTPS: 10000 - 10900
- SOCKS5: 12000 - 12010
Steps: Steps: To Test the Latency and Success Rate of Your Proxies
Step 1: Installing Required Libraries
Before running the script, you need to install the required Python libraries. Run the following command to install them:requests: To send HTTP requests.matplotlib: To plot the test results.numpy: To calculate statistical values.collections: To count occurrences of error messages.
Step 2: Configuring Proxy Settings
The script supports both SOCKS5 and HTTPS proxies. You can configure which one to use by setting theuse_socks5 flag to True or False.
SOCKS5 Proxy Example:
If you need to use a SOCKS5 proxy, setuse_socks5 = True:
HTTP Proxy Example:
For HTTP proxies, setuse_socks5 = False:
username and password with your actual credentials.
Step 3: Configuring Test Parameters
The script allows you to configure various parameters for the proxy testing. You can change the target country, target URL, number of requests, and other settings.Customizing Test Settings:
Step 4: Sending Concurrent Requests
The script uses theThreadPoolExecutor to send requests concurrently. Each request is timed, and the status code and latency are recorded.
fetch_url(i) handles sending each request and logs either a successful status code or an error (timeout or other exceptions).
Step 5: Analyzing and Visualizing Results
After the requests have been completed, the script processes the results and visualizes them in a graph. The graph shows latency across all requests, with color-coded markers for different status codes (200, timeout, error).Graph Example:
The following graph is an example of the output you will receive after running the script: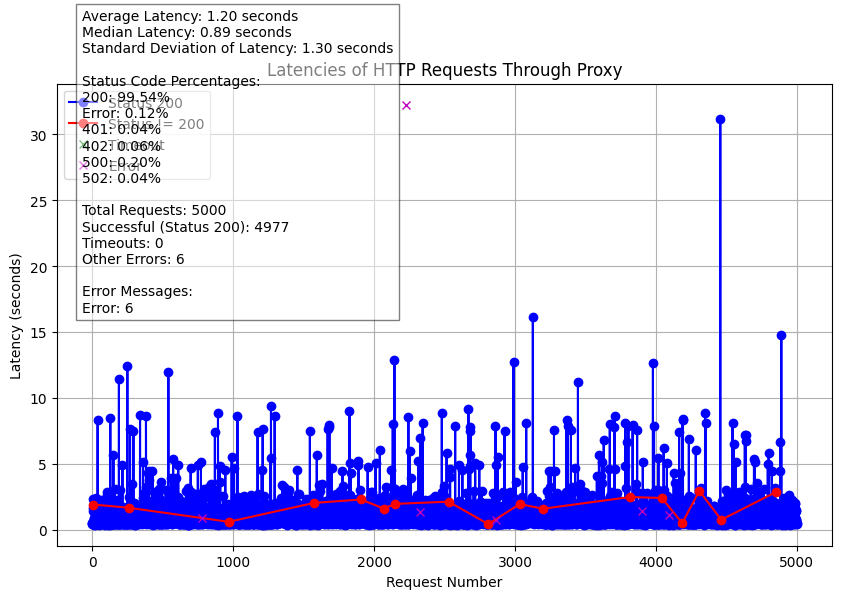
- Blue markers: Successful requests (Status 200).
- Red markers: Requests with non-200 status codes (e.g., 404, 500).
- Green markers: Requests that timed out.
- Magenta markers: Requests with other errors.
Step 6: Displaying Test Results
The script calculates statistical data about the test results, such as the average latency, median latency, and standard deviation. It also counts the number of successful requests (Status 200) and logs any errors or timeouts.Example Output:
Here is an example of the statistics that will be displayed after the test:Step 7: Interpreting the Results
Based on the output, you can analyze the performance of the proxy:- Success Rate: The percentage of successful requests (Status 200) versus failed requests.
- Latency: The average time taken for requests to complete.
- Error Distribution: The breakdown of errors, such as timeouts or other issues.
Source Code
You can find the full source code for this script on GitHub at the following link: https://github.com/geonodecom/proxy-testing-toolkit/tree/performance-testing/success-latencyFAQs
Which proxy protocols are supported by the script?
Which proxy protocols are supported by the script?
The script supports both SOCKS5 and HTTPS proxy protocols. You can configure which protocol to use by setting the
use_socks5 variable to True for SOCKS5 or False for HTTPS.What is the difference between rotating and sticky ports?
What is the difference between rotating and sticky ports?
- Rotating Ports: These ports change your proxy IP on each request, providing a more diverse set of IP addresses for accurate benchmarking.
- Sticky Ports: These allow you to maintain the same IP address for a specific duration, ensuring a stable and consistent connection.
How many requests should I send to get accurate results?
How many requests should I send to get accurate results?
For accurate benchmarking, it’s recommended to send at least 2000 requests using 5-10 concurrent threads. This will help smooth out any anomalies and give you a better representation of the proxy’s performance.
What is the role of `ThreadPoolExecutor` in the script?
What is the role of `ThreadPoolExecutor` in the script?
The
ThreadPoolExecutor allows the script to send requests concurrently, improving efficiency and speed. By utilizing multiple threads, the script can handle several requests at the same time, simulating real-world use cases where many requests are sent in parallel.What do the different markers in the latency graph represent?
What do the different markers in the latency graph represent?
In the resulting graph:
- Blue markers represent successful requests (Status 200).
- Red markers represent requests that returned a non-200 status code (e.g., 404, 500).
- Green markers represent requests that timed out.
- Magenta markers represent requests that encountered other errors.
How do I interpret the statistics displayed after the test?
How do I interpret the statistics displayed after the test?
The script will display:
- Average Latency: The mean time it took for all requests to complete.
- Median Latency: The middle value in the latency data set.
- Standard Deviation: A measure of how much latency varies from the average.
- Status Code Percentages: The breakdown of the status codes (e.g., how many requests were successful, timed out, or encountered errors).
Can I change the target URL for testing?
Can I change the target URL for testing?
Yes! You can replace the default target URL (
ip-api.com) with any URL you wish to test. Just modify the url variable in the script.What should I do if the script encounters a timeout or error?
What should I do if the script encounters a timeout or error?
The script handles timeouts and errors gracefully. If a request times out or encounters an error (e.g., connection refused), it logs the error message and continues the test. You can then review the error messages and the status code distribution to assess any issues with the proxy.
How do I analyze the results and take action?
How do I analyze the results and take action?
Once the test is complete, analyze the graph and statistics. If you see a high percentage of errors or timeouts, you may need to adjust your proxy configuration or test with a different gateway. The results can guide you in optimizing your proxy settings for better performance.
Why is the test result for different gateways different?
Why is the test result for different gateways different?
Test results can vary depending on the location and performance of the proxy gateway you choose. For example, proxies from different geographic regions may have different latencies or success rates. You can experiment with different gateways to see how each affects the proxy’s performance.