General proxy usage
Usage Stats & Analytics
This guide explains how to track, analyze, and optimize your proxy usage using the Geonode dashboard.
Monitoring usage statistics helps you manage bandwidth efficiently, improve performance, and troubleshoot issues early.
Step 1: Access the Geonode Dashboard
- Log in to your Geonode account.
- Open the Dashboard to see an overview of your key information:
- Available bandwidth
- Billing cycle and renewal dates
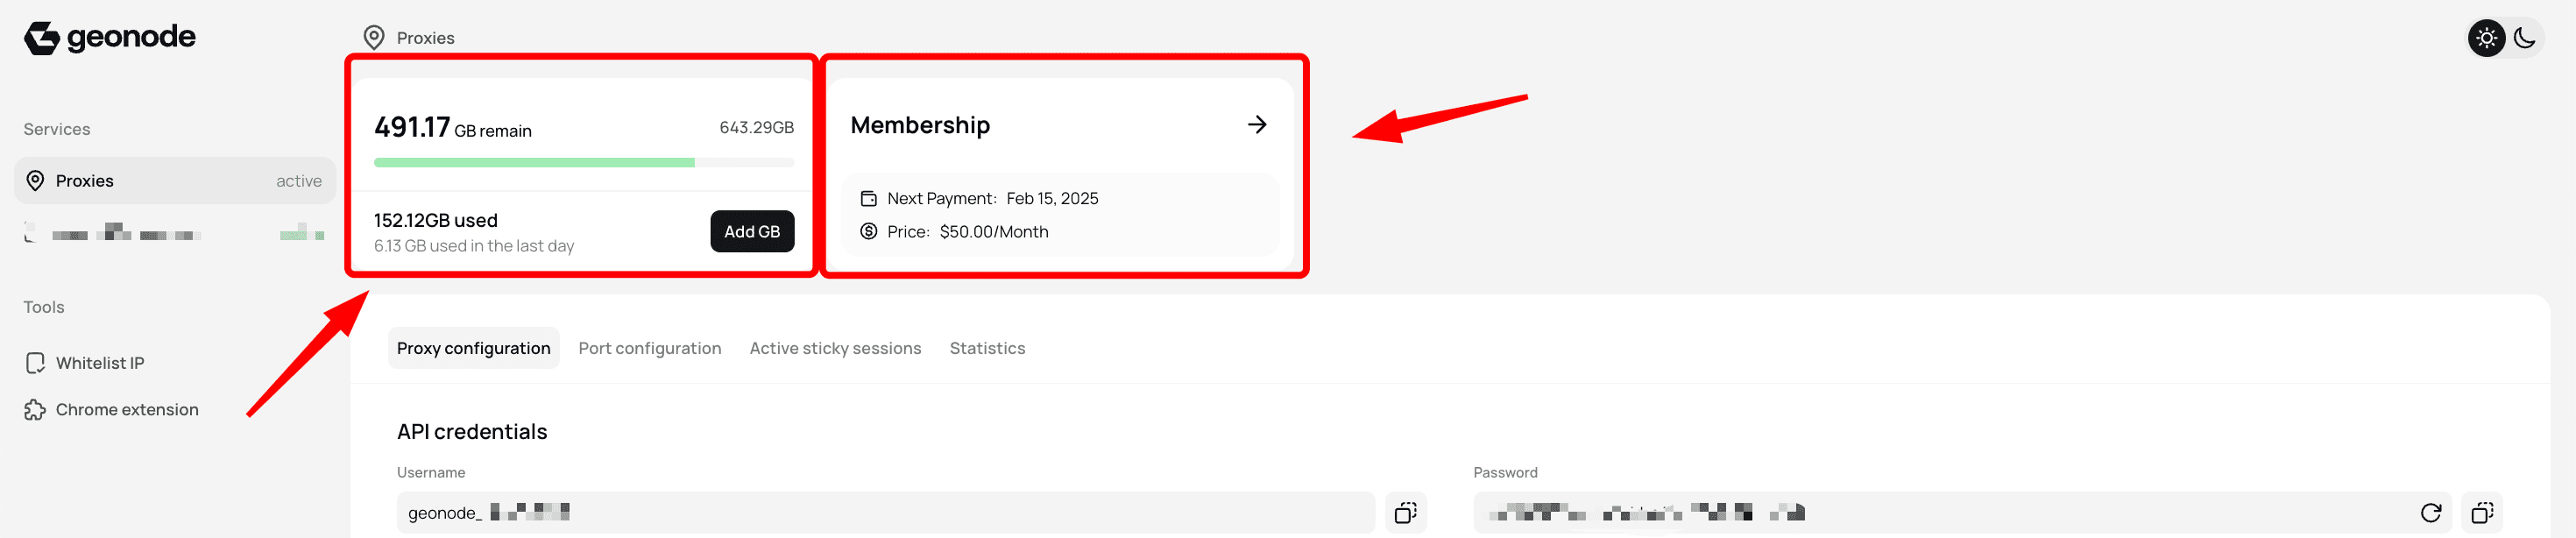
Step 2: View Usage Statistics
In the Statistics section, you can explore detailed proxy performance metrics.
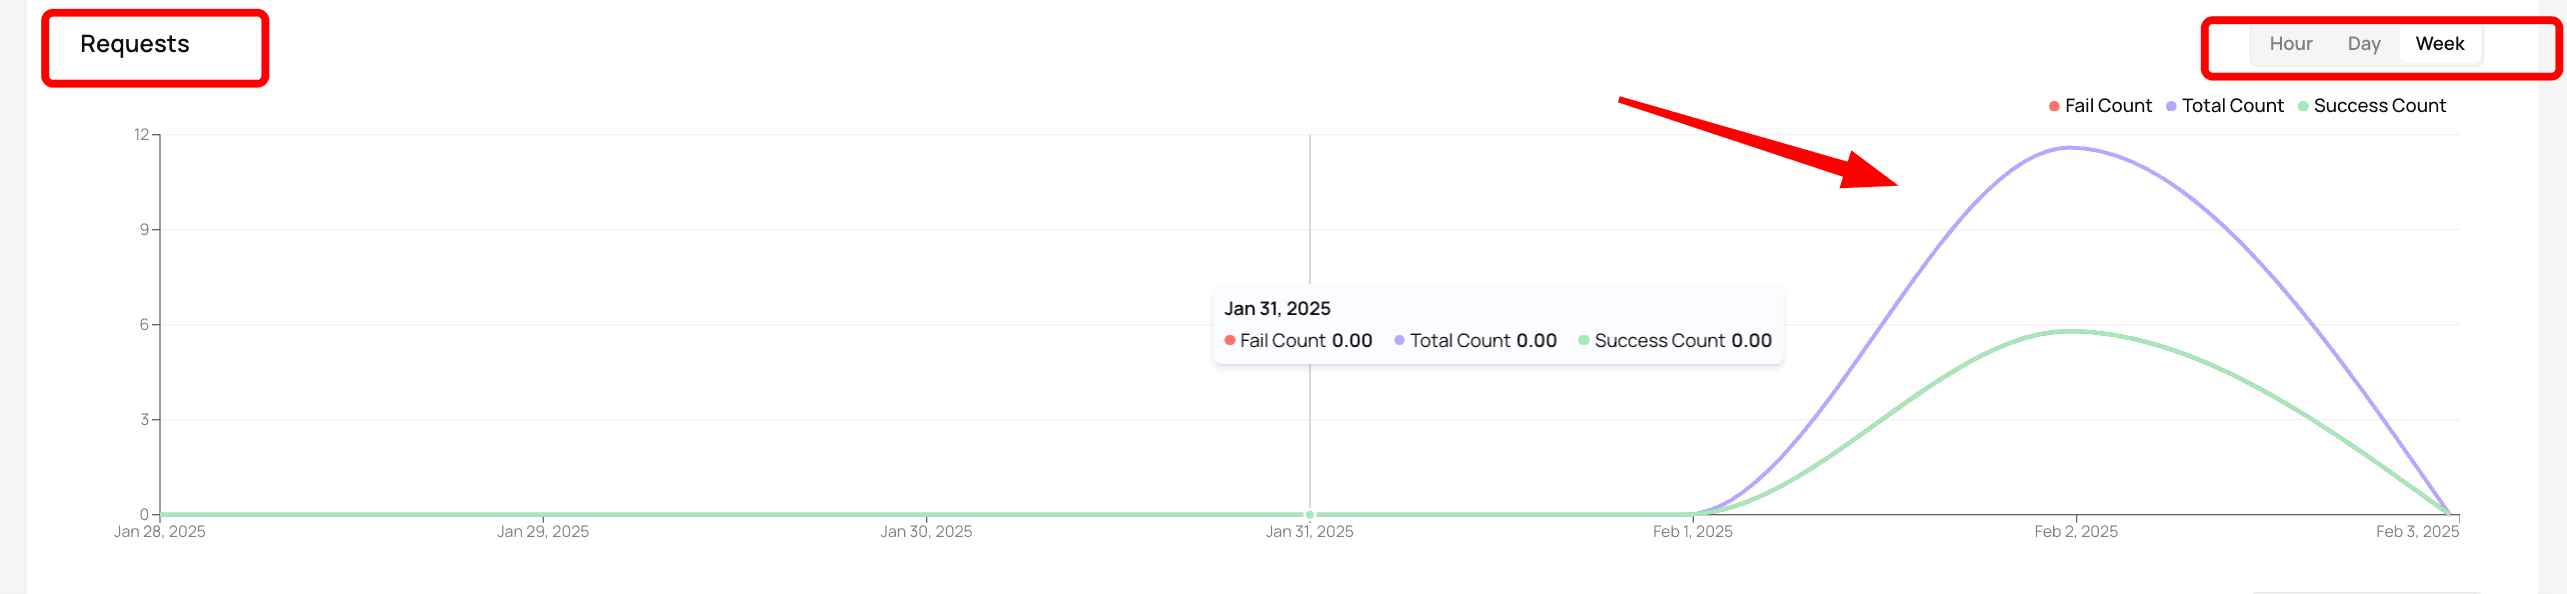
Request Metrics
A visual overview of your request activity, including:
- Successful Requests – Proxies that connected successfully.
- Failed Requests – Requests that encountered errors or blocks.
- Total Requests Sent – The complete count of requests made through your proxies.
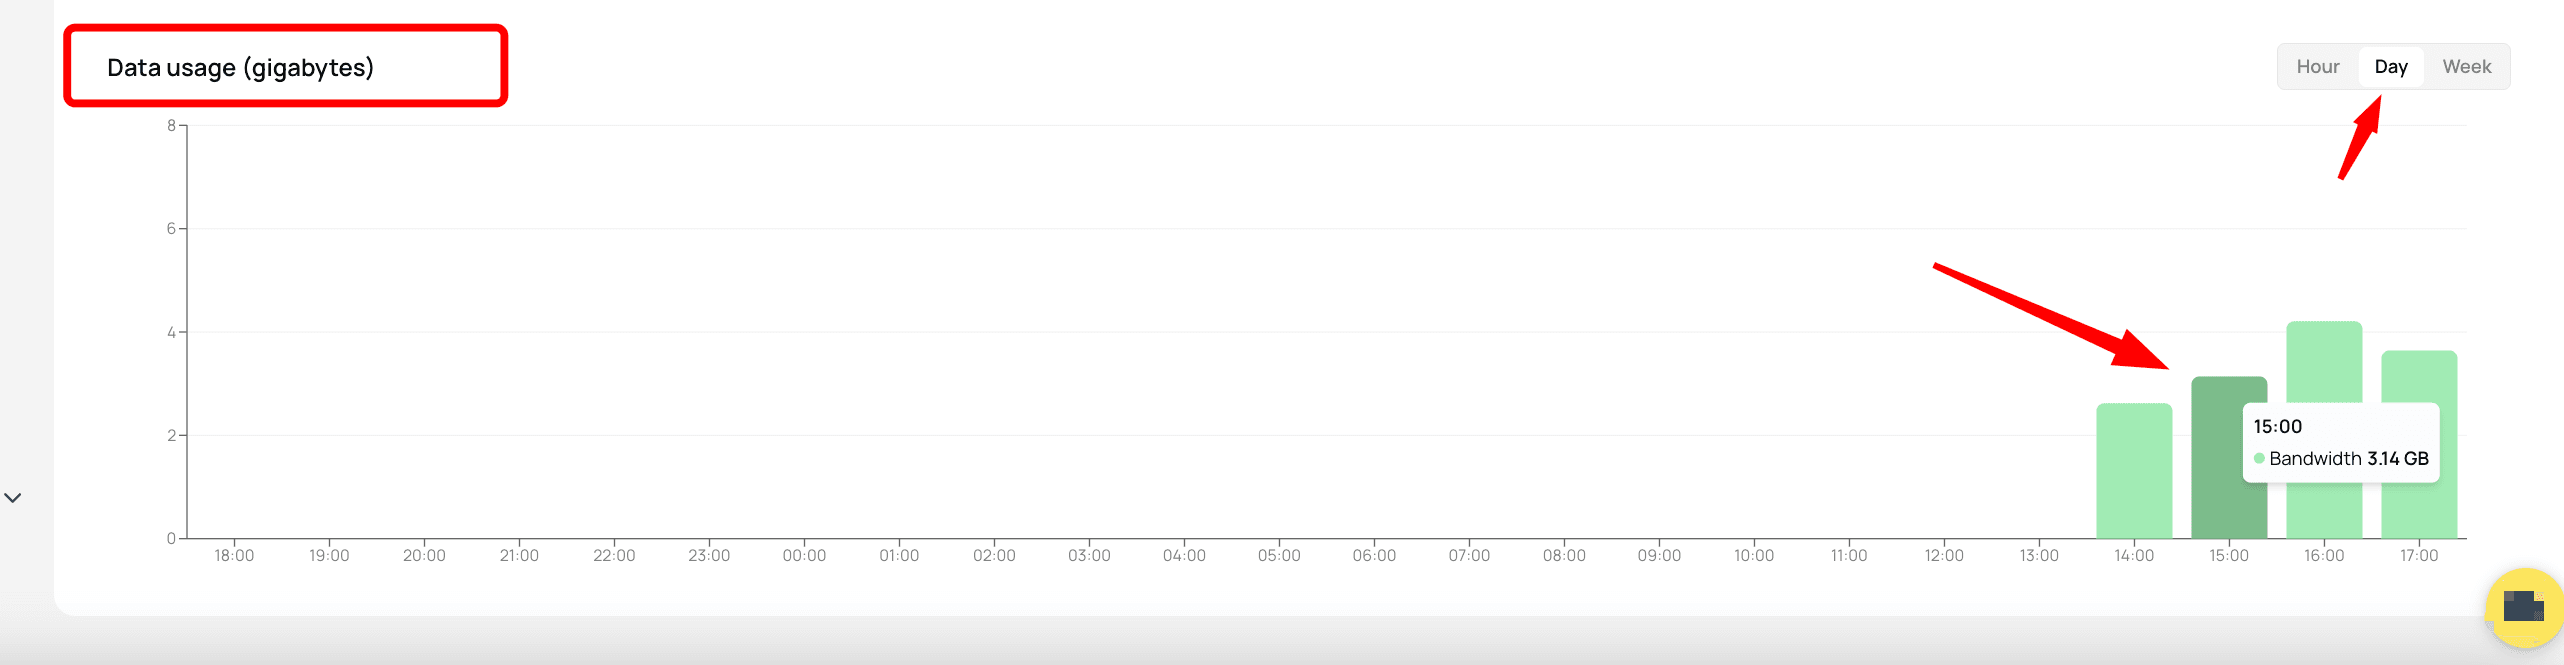
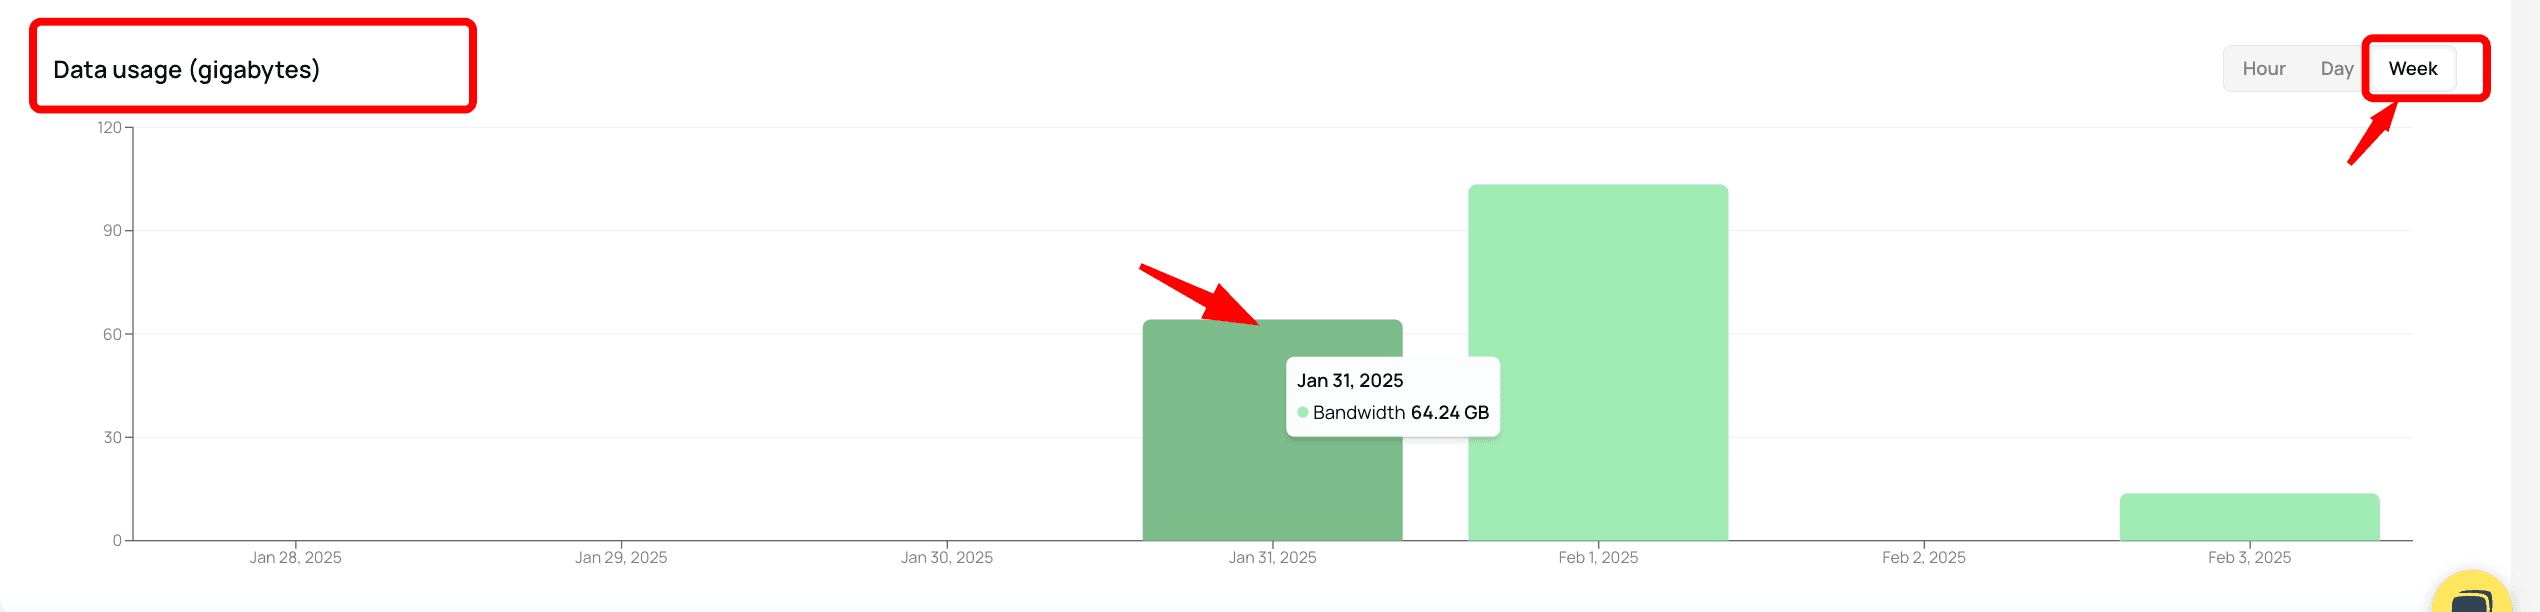
Data Usage Monitoring
Keep track of your bandwidth and usage trends:
- Daily Bandwidth Consumption – See how much data is used each day.
- Hourly Usage Trends – Identify peak usage hours to optimize resources and balance workloads.
This information helps you spot inefficiencies and adjust configurations for better proxy performance.
Final Tips
- Check usage regularly to ensure efficient proxy operation.
- Review failed requests to identify network or configuration issues.
- Use hourly and daily analytics to optimize your bandwidth strategy.
By leveraging Geonode’s analytics tools, you can maintain stable connections, reduce errors, and optimize your proxy performance.